We use cookies to ensure that we give you the best experience on our website. By continuing to use this site, you agree to our use of cookies in accordance with our Privacy Policy.
Privacy Overview


If you had $58B, you would be among some interesting company. $58B represents more wealth than Larry Page and Michael Bloomberg, but not enough to surpass Warren Buffett, Bill Gates, and Jeff Bezos. Here at MarketSmart we certainly don’t have $58B sitting around, however we are privileged enough to have access to $58B in anonymous donation data from the 5,500+ users of our free Fundraising Report Card.
If you’re unfamiliar with the Fundraising Report Card, it’s a free (no gimmicks, no credit card, seriously free) data visualization and reporting software, designed specifically for fundraising metrics (think retention donor retention rates, donor lifetime value, and more).
We built Fundraising Report Card back in 2017, and decided to make it 100% free for nonprofits earlier this year. You can learn more about Fundraising Report Card here.
Building out this separate software provided some unique opportunities for our team. As more and more nonprofits used the software we realized we were collecting a treasure-trove of data. Now, to be fair, the information we collect is very simple (a donor ID #, a donation date, and a donation amount), and our terms of service explicitly state we will not sell, lease, or trade that data. However, you can take this simple and anonymous dataset, and create something valuable. This is where the idea for Live Benchmarks came from.
Think of Live Benchmarks as the largest community-based fundraising benchmark group in the world. With over $58B in donations (and growing everyday), Live Benchmarks provides a snapshot in time of key fundraising metrics. Instead of waiting for an annual or quarterly report, you can see changes in key giving metrics every day, and you can segment the benchmarks by industry sector (i.e. health, or religion). Neat right?
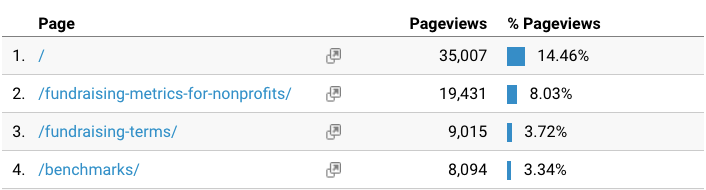
Since we launched Live Benchmarks over 8,000 people have accessed them, making it our fourth most visited page on the website. Our team is thrilled that so many nonprofit professionals can get value out of what we’ve created!
But what does this have to do with you and your fundraising shop? Well, it turns out there’s a lot you can learn from $58B in donations!
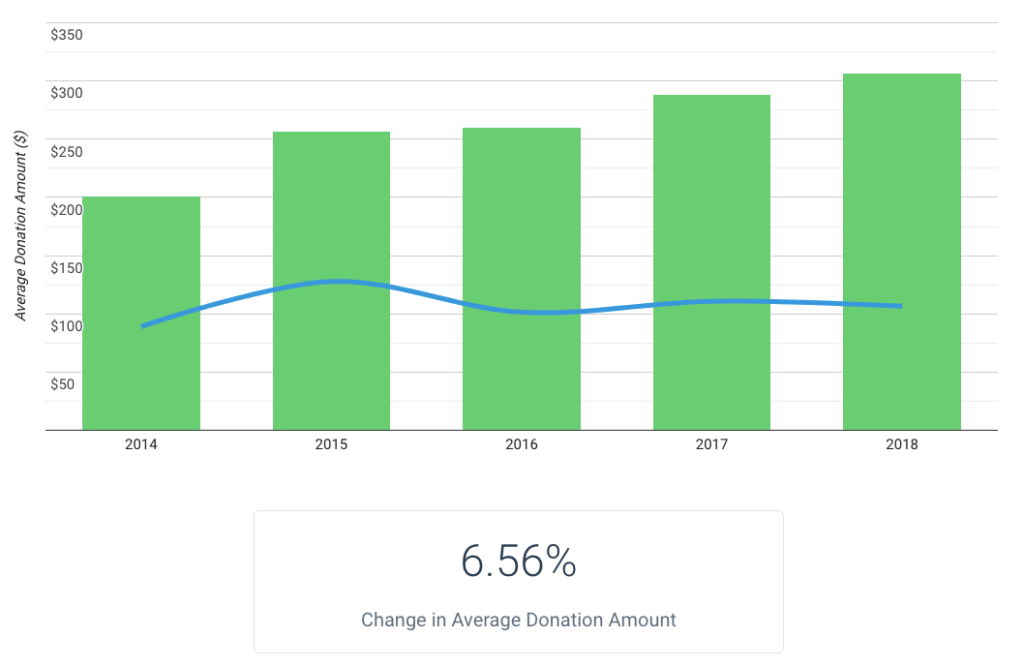
It’s no secret that the total number of donors is dwindling while the total amount of dollars given is increasing. This can only mean one thing, average donation amounts are going up. Live Benchmarks confirms this, measuring a 6.56% increase in average donation amount from 2017 to 2018.
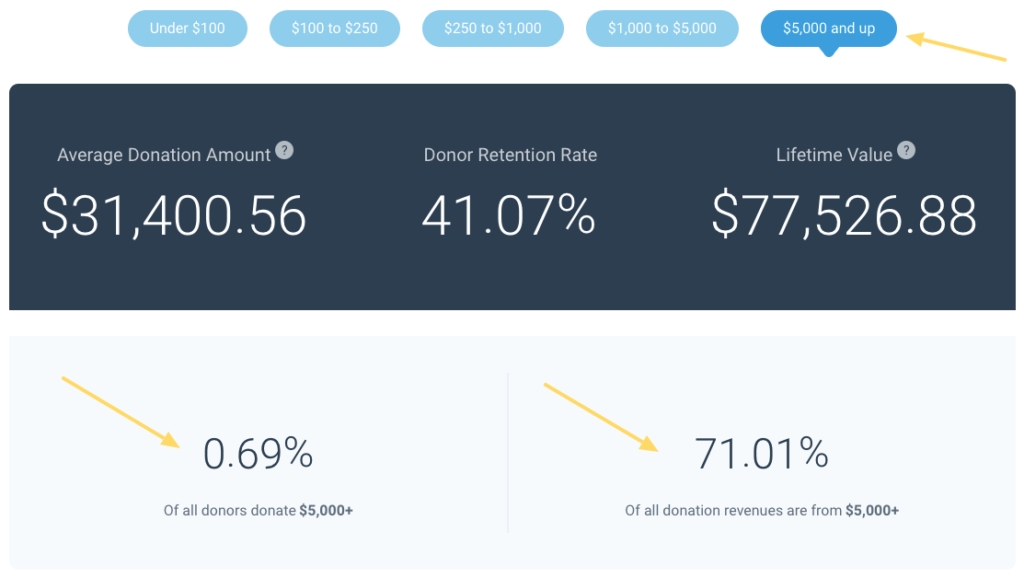
MarketSmart CEO, Greg Warner has written extensively about the 70/.7 rule. Gone are the days of the 80/20 rule, Live Benchmark data shows that donors contributing $5,000 or more make up 71% of all donation revenue, however they represent just .69% of all donors. This is mind boggling!
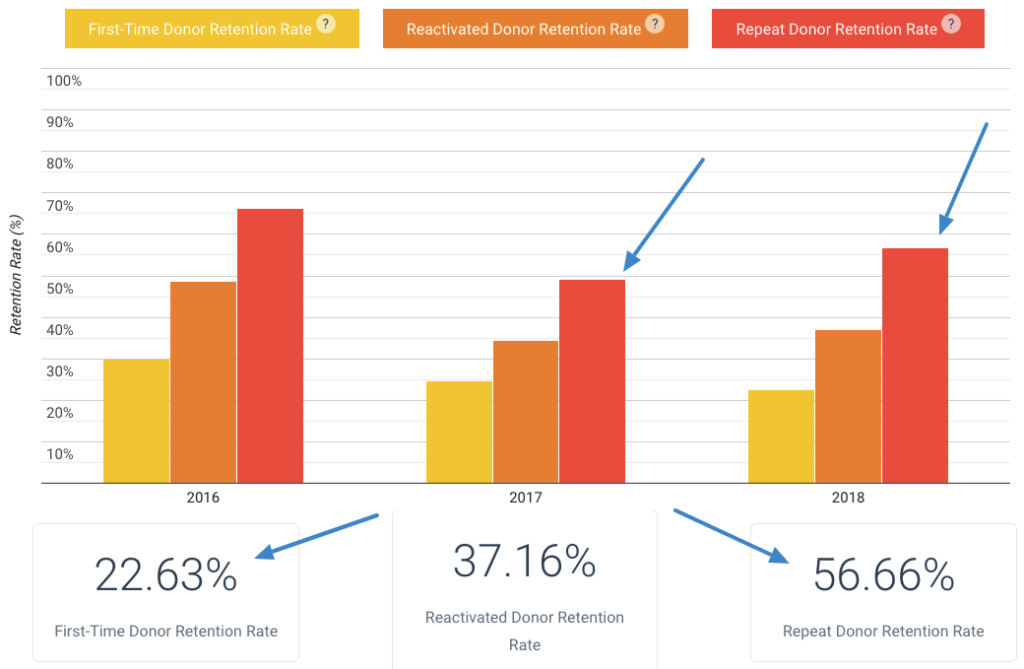
If a donor makes a contribution two years in row, it would intuitively make sense that they would be more likely than a newly acquired donor to make a donation in the following year, right? Live Benchmarks backs up this rationale (and quantifies it!). We can see that repeat donor retention rate is more than double first-time donor retention rate. That means as a sector we retain two repeat donors for every newly acquired donor. Fascinating!
We can also see an increase in 2018 for repeat donor retention as compared to 2017. This indicates that more repeat donors renewed in 2018 than did in 2017, a good trend that we’d like to see continue!
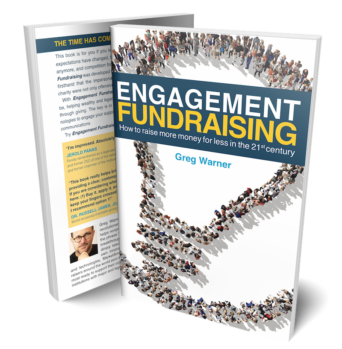
Feeling like your job is getting harder because donor expectations have changed and competition for the charitable dollar is growing?
Finding that the old orthodoxies and conventions espoused by so-called experts in online echo-chambers and at conferences don’t work anymore?
Want to help more people make impact by facilitating their acts of philanthropy but feel like too many obstacles keep getting in your way?
Then this book is for you.
Engagement Fundraising was developed from the perspective of a donor who discovered firsthand that the impersonal, spray-and-pray approaches of his beloved charity were not only offensive but also wasteful and ineffective. So he took action. And now, you can too.
Subscribe to our blog today and get actionable fundraising ideas delivered straight to your inbox!